Transforming text into beautiful charts effortlessly.
-
Added on July 10, 2023
-
Updated on December 4, 2023
-
7 views (powered by Overtracking Analytics)
Product information and features
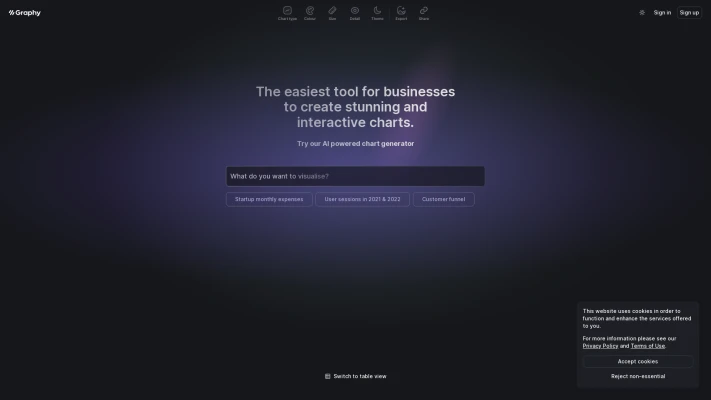
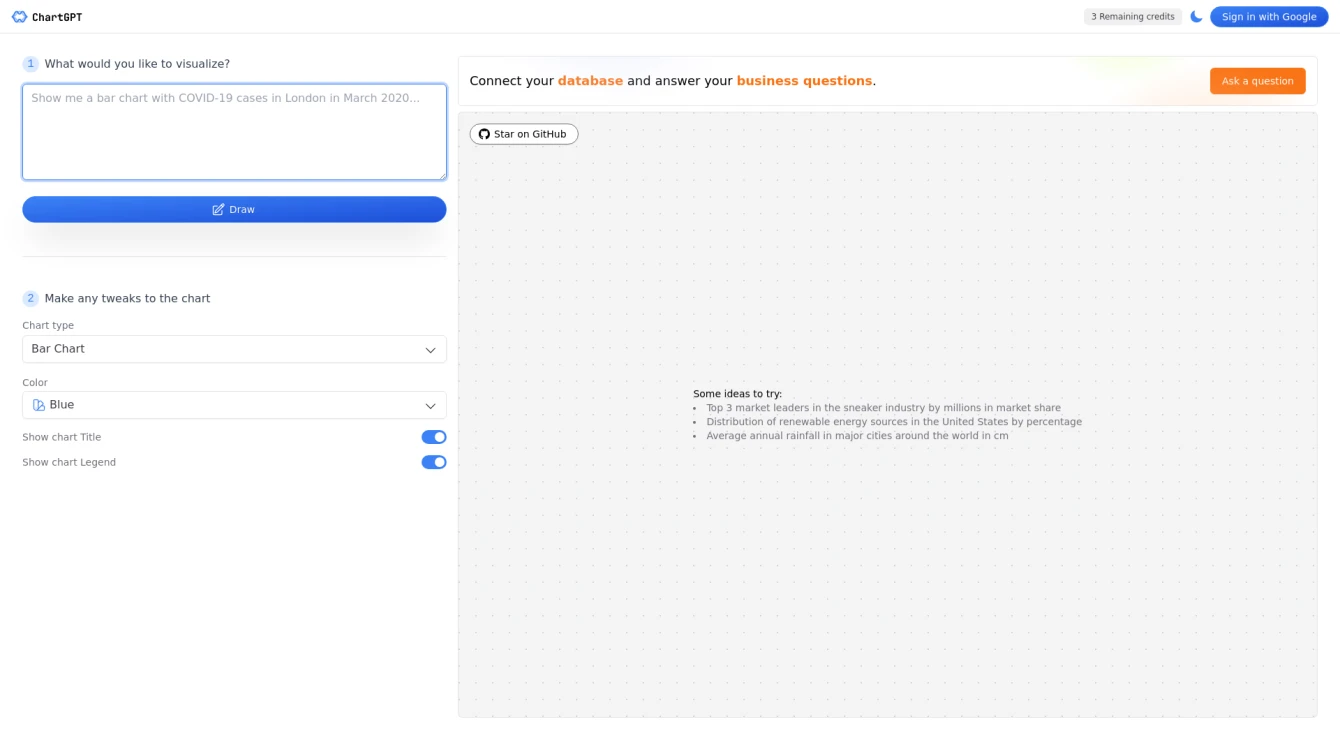
Imagine an AI tool that breathes life into your data by transforming it into visually compelling charts. That's exactly what ChartGPT does. It leverages advanced technologies like React, Next.js, OpenAI, and Tailwind CSS to turn your textual data into engaging graphs.
Simply input your data in text form, and watch as ChartGPT does the heavy lifting for you. It's perfect for individuals who require rapid data visualizations, such as data scientists, researchers, or anyone presenting data-driven information.
The core of ChartGPT's success lies in its utilization of OpenAI. This technology ensures that the charts generated are not only accurate but also capable of handling complex and unstructured data inputs. The result? Beautifully formatted charts that simplify data comprehension and sharing.
ChartGPT's user-friendly interface and easy setup are additional reasons to give it a try. Plus, it's available on GitHub, making it a convenient choice for developers looking to incorporate the tool into their existing projects.
In summary, ChartGPT is a game-changer in the realm of data visualization. It's a tool that effortlessly converts text into stunning charts, offers a user-friendly experience, and integrates easily with GitHub. It's a must-have for anyone looking to simplify data analysis and presentation.
Tell the world ChartGPT has been featured on NaNAI.tools:
ChartGPT Reviews
What's your experience with ChartGPT?
0 global ratings
There are no reviews yet.
